rbf_includeFusionChartsLibrary()
Purpose
This method includes fusion charts library into the runtime pages. With fusion charts library loaded on the web page, users can render or plot fusion charts and gauges.
Note: This API is available only in New UI pages.
Syntax
rbf_includeFusionChartsLibrary (callback)
Parameters
callback
A callback function that gets executed after the fusion chart's library is loaded
Example
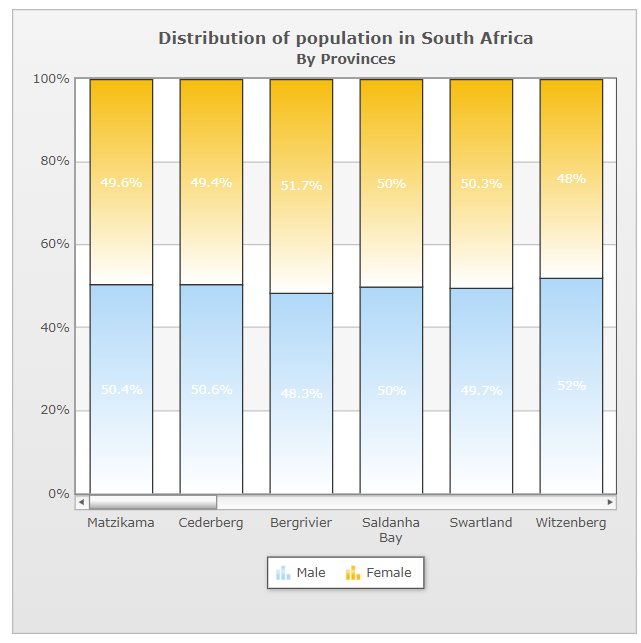
To render a stacked chart from FusionCharts list, run the following code. Make sure you have a div element with correct id ‘chart-container’ as specified in the following example:
Copy
rbf_includeFusionChartsLibrary(function() {
const dataSource = {
  chart: {
    caption: "Distribution of population in South Africa",
    subcaption: "By Provinces",
    numvisibleplot: "6",
    showvalues: "1",
    decimals: "1",
    stack100percent: "1",
    valuefontcolor: "#FFFFFF",
    plottooltext:
      "$label has $dataValue (<b>$percentValue</b>) $seriesName population",
    theme: "fusion"
  },
  categories: [
    {
      category: [
        {
          label: "Matzikama"
        },
        {
          label: "Cederberg"
        },
        {
          label: "Bergrivier"
        },
        {
          label: "Saldanha Bay"
        },
        {
          label: "Swartland"
        },
        {
          label: "Witzenberg"
        },
        {
          label: "Drakenstein"
        },
        {
          label: "Stellenbosch"
        },
        {
          label: "Breede Valley"
        },
        {
          label: "Langeberg"
        },
        {
          label: "Swellendam"
        },
        {
          label: "Theewaterskloof"
        },
        {
          label: "Overstrand"
        },
        {
          label: "Cape Agulhas"
        },
        {
          label: "Kannaland"
        },
        {
          label: "Hessequa"
        },
        {
          label: "Mossel Bay"
        },
        {
          label: "George"
        },
        {
          label: "Oudtshoorn"
        },
        {
          label: "Bitou"
        },
        {
          label: "Knysna"
        },
        {
          label: "Laingsburg"
        },
        {
          label: "Prince Albert"
        },
        {
          label: "Beaufort West"
        }
      ]
    }
  ],
  dataset: [
    {
      seriesname: "Male",
      data: [
        {
          value: "35789"
        },
        {
          value: "26776"
        },
        {
          value: "32567"
        },
        {
          value: "55584"
        },
        {
          value: "66443"
        },
        {
          value: "67912"
        },
        {
          value: "138421"
        },
        {
          value: "85250"
        },
        {
          value: "85695"
        },
        {
          value: "52119"
        },
        {
          value: "20133"
        },
        {
          value: "59228"
        },
        {
          value: "46296"
        },
        {
          value: "17830"
        },
        {
          value: "11786"
        },
        {
          value: "26397"
        },
        {
          value: "45763"
        },
        {
          value: "102850"
        },
        {
          value: "46805"
        },
        {
          value: "29595"
        },
        {
          value: "36523"
        },
        {
          value: "4418"
        },
        {
          value: "6947"
        },
        {
          value: "24577"
        }
      ]
    },
    {
      seriesname: "Female",
      data: [
        {
          value: "35256"
        },
        {
          value: "26173"
        },
        {
          value: "34906"
        },
        {
          value: "55588"
        },
        {
          value: "67319"
        },
        {
          value: "62635"
        },
        {
          value: "141774"
        },
        {
          value: "88170"
        },
        {
          value: "90883"
        },
        {
          value: "53364"
        },
        {
          value: "20078"
        },
        {
          value: "57882"
        },
        {
          value: "47169"
        },
        {
          value: "18170"
        },
        {
          value: "12382"
        },
        {
          value: "27839"
        },
        {
          value: "48372"
        },
        {
          value: "105387"
        },
        {
          value: "50703"
        },
        {
          value: "29563"
        },
        {
          value: "37312"
        },
        {
          value: "4477"
        },
        {
          value: "7325"
        },
        {
          value: "26503"
        }
      ]
    }
  ]
};

FusionCharts.ready(function() {
  var myChart = new FusionCharts({
    type: "scrollstackedcolumn2d",
    renderAt: "chart-container",
    width: "100%",
    height: "100%",
    dataFormat: "json",
    dataSource
  }).render();
});

});
Output