Using charts
To make a chart available for viewing on a page, use the page editor to add the chart component to an empty section on a generic or object list view page. This will display the selected chart on that page, along with a toolbar:
From the section containing the chart, you can do the following:
- Click the reload button next to the section title to reload the chart.
- Select another chart from the first drop-down menu.
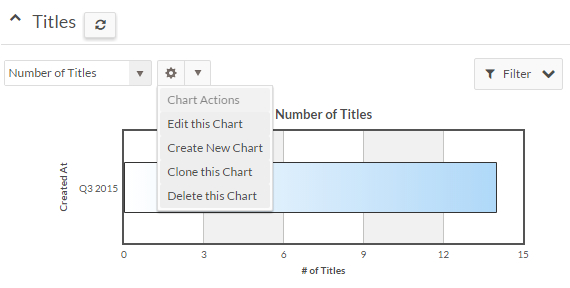
- Select Edit this Chart from the chart actions menu to edit the chart.
- Select Create New Chart from the chart actions menu to edit the chart.
- Select Clone this Chart from the chart actions menu to clone the chart.
- Click Filter to dynamically filter data visualized in the selected chart.
- Right-click the chart and select Download SVG Vector Image to save an XML-based image of the chart.
The administrative permission Manage Charts is required to edit, create, and clone charts.
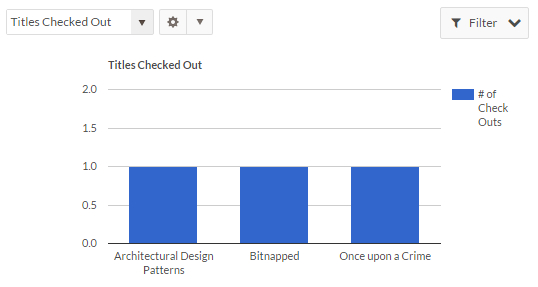
An example FusionChart:
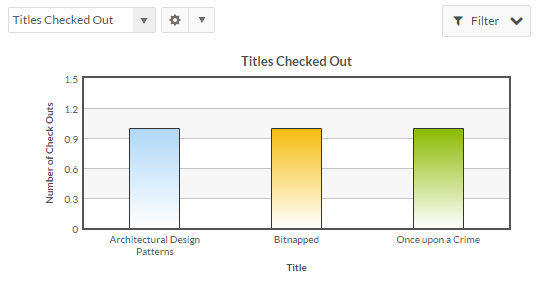
An example Google chart: