Creating and configuring gauges
To create a gauge:
- Navigate to an object definition page, select Gauges from the ribbon, and click New Gauge.
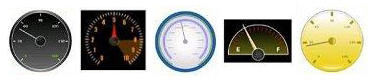
- Select a Gauge Style:
- Type a Gauge Title for the gauge.
- Select a Gauge Size: Large, Medium, or Small.
- Select Show Background Border to
show or hide the border for the gauge container.Note: The Show Background Color property is not available for the following gauge styles.
- Select the Annotation Type for the gauge. This can be Number, Percent, or one of several currencies.
- Select the Min Value and Max Value to represent the beginning and end of the gauge's display range. Platform renders the computed value by positioning the gauge's arrow relative to these values. Optionally type a Label for each of these values.
- Optionally set a Lower Range Color,
Middle Range Color, and an Upper Range Color to customize the data range color for lower
range, middle range and upper range based on the context in which the gauge will be used.
Platform uses the First Midpoint Value and Second Midpoint Value values to visually indicate the gauge's
lower, middle, and upper range values.Note: The Data Range Color properties are not available for the following gauge styles.
- Optionally set a Plot Fill Color.Note: This field is available only for the Vertical Linear Gauge.
- Specify the JavaScript formula to compute the gauge's value. If you use the gauge to visualize data for a particular record, use tokens from that record and its related records. If you use the gauge is to visualize data from a list of records, use a loop to iterate over records, compute and return a final value. You can also use the Platform Query API in gauges. For more information about formulas, see Formulas.