Creating Tabular Reports
Tabular reports are the most common type of reports in applications. Platform
renders tabular reports as rectangular tables in which each row represents a data record and
each column represents a field value. You can define up to seven layers in tabular reports
with a list of related records rendered under the parent row. Platform Private Cloud
administrators can set the shared property TabularReportLayeringLimit to override the default value; see Shared Properties for more information.
You can create a new report in the following ways:
- Click New Report in the Reports tab in the default Platform application.
- Open an object definition, click Reports in the ribbon, and click New Report.
- Open any page containing a section with a report link and click New Report in that section's header.
Note that only administrators can create reports. For more details about user roles, see Role-based access control.
To create a tabular report:
- Navigate to the New Report page using one of the methods described above.
- Select an object type to report on and select Tabular as the Report Type.
- Specify a Report Name.
- Type a Description for the report.
- In the Private category, select Private Reports are only available to their creator and Hide count of total records for this View checkboxes as needed.
- From the Export Options
drop-down, select any one of the following options:
Traditional: Renders report columns with associated data across multiple rows.
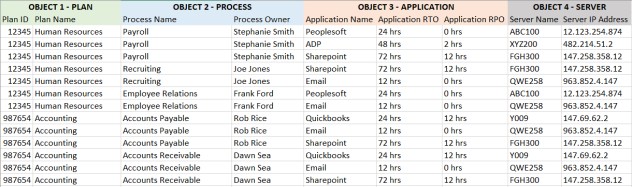
Export Multi-levels as Flat List : Flattens" the exported data of the multi-layer tabular report.
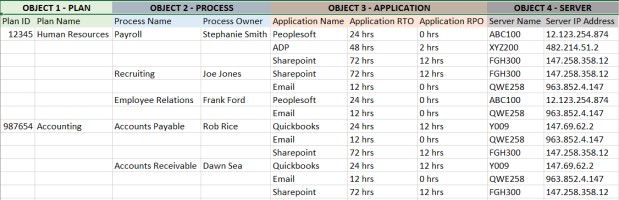
Export multi-levels as flat list with no duplicates: To ensure that the data for each layer of the tabular report is repeated in each row recursively with an option to flatten without repeating the data.
On the first row, add the object names of the object at each level and align the object name with the first field exported with that level.
The data export layers limit is controlled by the shared property
TabularReportLayeringLimitand is applicable for export to XLS, XLSX, CSV and PDF formats.Each level is limited to the maximum number of records as specified by the shared property
MaxExportRows.Here's a sample view of a multi-level flat list:
Here's a sample view of a multi-level flat list without repeats/duplicate records:
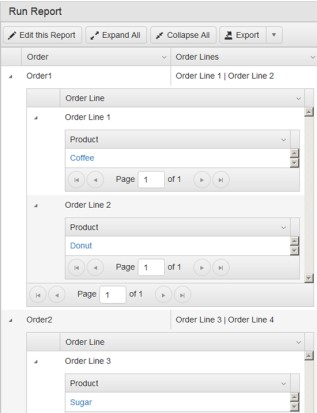
The following image shows an example of a report with three layers of data. Each layer can be expanded or collapsed entirely by clicking either Expand All or Collapse All as well as individually by expanding or collapsing each row:
- In the Report Name Template
field, specify a name for the report template. You can use date, month, and/or year
tokens. If you do not input any value, the name of the report is used as the file name by
default. Special characters are converted to underscore in file names.Note: You can see the tabular report names reflected when you send report emails, create new batch jobs, use report filters, and use report tokens in Document template.
- Specify the report columns, sorting and grouping, and report filters.
You can report on all deployed objects, system objects, audit trails, system error logs,
and log-in history records.
If you want multi-layer reporting, that is, if each row in the report must include a report about the related records, specify the Relationship between the two layers. You must define your report's columns, sorting and filtering conditions for Layer 1, similar to the way you define list views but with the added option to select a relationship for Layer 2 records. If you choose a related object to display in a second layer, Platform will create Layer 1 and then open the Layer 2 edit page. You can create more layers in a similar manner if desired. In the second and subsequent layers, you can report on comments and activity trail records related to the Layer 1 record (that is, the parent record).
Note: You can make a report private if you want the report to be available only to you. Also, if your object has defined charts, you can select a chart to be included in the report. - Click Save. The saved report appears in the Reports grid table.